
Summary (TLDR)
- I deconstruct your lifetime work years, hours, and income and show it in a graphic format and as an Excel workbook (that you can download and modify).
- To make it easy for you to understand and remember, I will also introduce some lifecycle maxims
Disclaimer: the maths may not be 100% accurate, but neither is the predictability of your life 🙂
Don’t tell me! I don’t want to know!
People typically never contemplate their full lifetime existence from a time and money perspective. By examining these things, you can proactively react in ways that could benefit you and your family.
How much you earn and how long you work profoundly impacts many aspects of your thoughts and identity, including (but not restricted to):
- Worldview
- Ideology
- Political Beliefs (Left, Center, Right): Views on Tax, Social Policies, Govt, etc.
- Ethics and Morality
Understanding the entire human working lifecycle also helps to shine a light on poorly explained or understood political tropes and narratives like:
- DIEE: Diversity, Inclusion, Equality/Equity, This out-of-date and often poorly understood ideology elevates an individual’s gender or minority group membership over hours, experience, or capability. e.g. A good person may have worked for 2 decades/36,000 hours in a specific field but because they belong to a ‘vilified majority group’ they are overlooked for another individual that belongs to a ‘cherry-picked minority group’ even though they may have only worked 6000 hours.
- Gender pay gap: Again this trope does not consider anything about hours worked, experience, and capability. Just vilification of another group!
- Home Ownership: Why don’t 30-year-olds own their own homes when 55-year-olds do?
- Income/Age/Time: Why and when do some people have more than others? Why and when are there poor, middle-class, and rich.
- Tax: Why do some feel not only entitled but also robbed by high-income earners’ tax money even though those high-income earners might pay 5x more tax than many others? We don’t consider that a 20ish-year-old might only pay ~15k tax per year and a 55-year-old may pay ~65k per year. Or a 20ish-year-old has contributed ~30k in tax vs a 55yo who may have contributed ~1 million
- Homelessness and Poverty: There are many different reasons for homelessness and poverty SOME people CHOOSE not to work and/or instead prioritize their individual freedom over their desire to work. This group of people may have only worked less than 10,000 hours in their entire lifetime even though they may be middle-aged.
- Political Ideology: Why and when do people at a certain age or income vote left/center/right?
Of course, everything I’ve stated above is a (cherry-picked) example only. There is a lot more to say on each point – but I have saved it for another blog (I’m not ready to be canceled in this one)
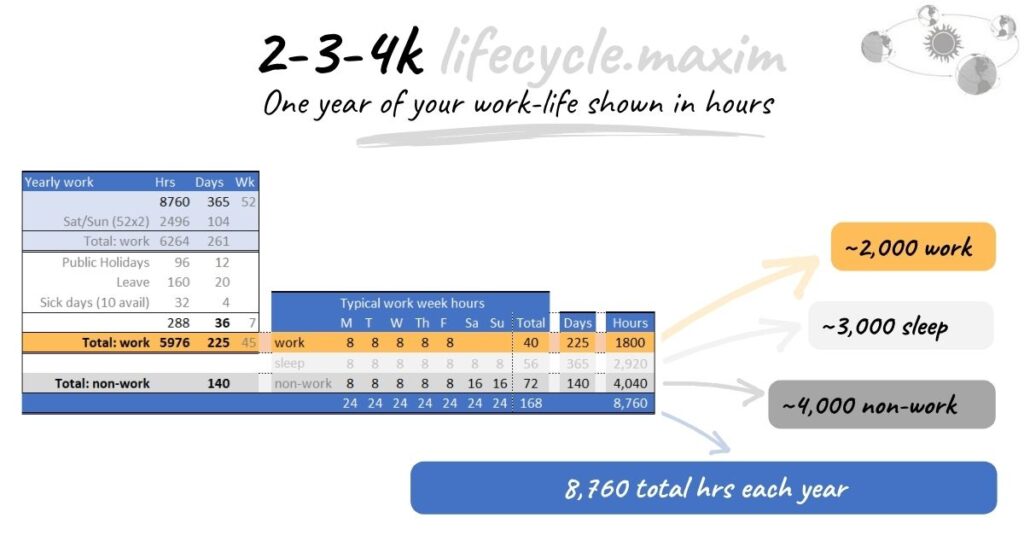
2-3-4k lifecycle maxim
- 1 year of your lifecycle will mean 2k work, 3k sleep, 4k non-work.
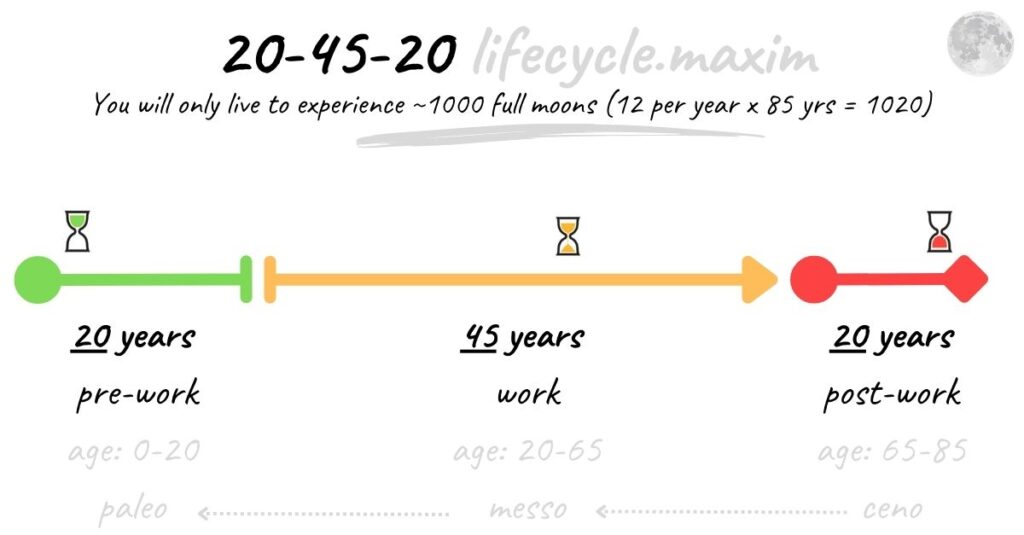
20-45-20 lifecycle maxim
- 85 years of your life might look like this.
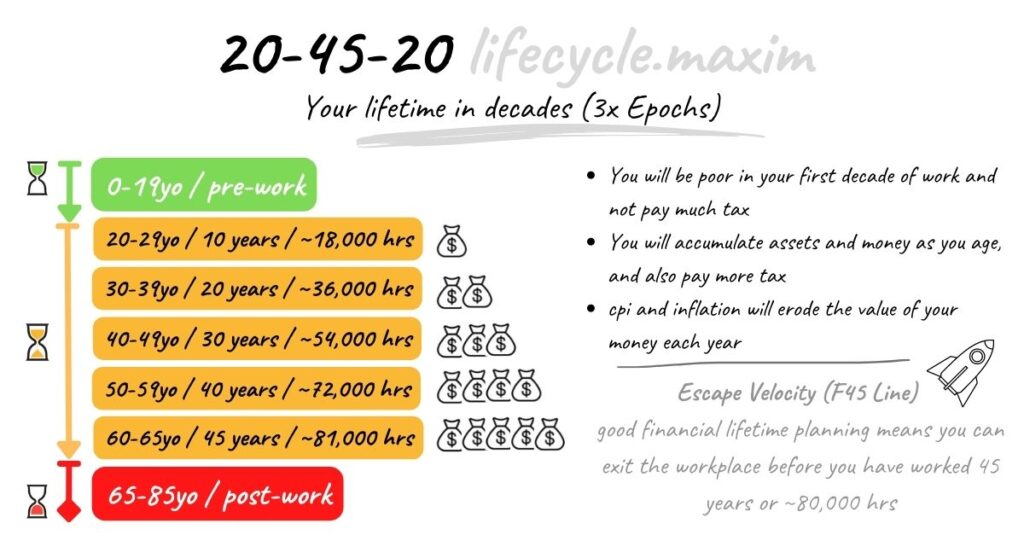
20-45-20 lifecycle maxim
- 85 years of your life might look like this.
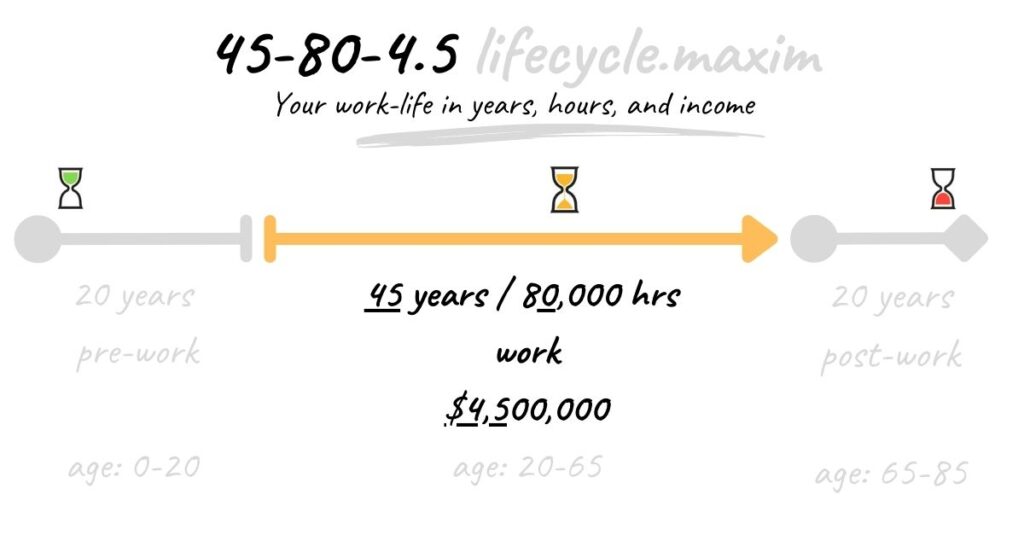
45-80-4.5 lifecycle maxim
- 45 years of your working life might look like this.
- Before you get too excited about earning 100k per year for 45 years…it doesn’t work like that because of CPI and Inflation. e.g. $100 of cocaine today might only buy the equivalent of $10 worth of cocaine in 40 years.
Consumer Price Index (CPI) Explained: What It Is and How It’s Used (investopedia.com)
Enough ranting, show me the data!
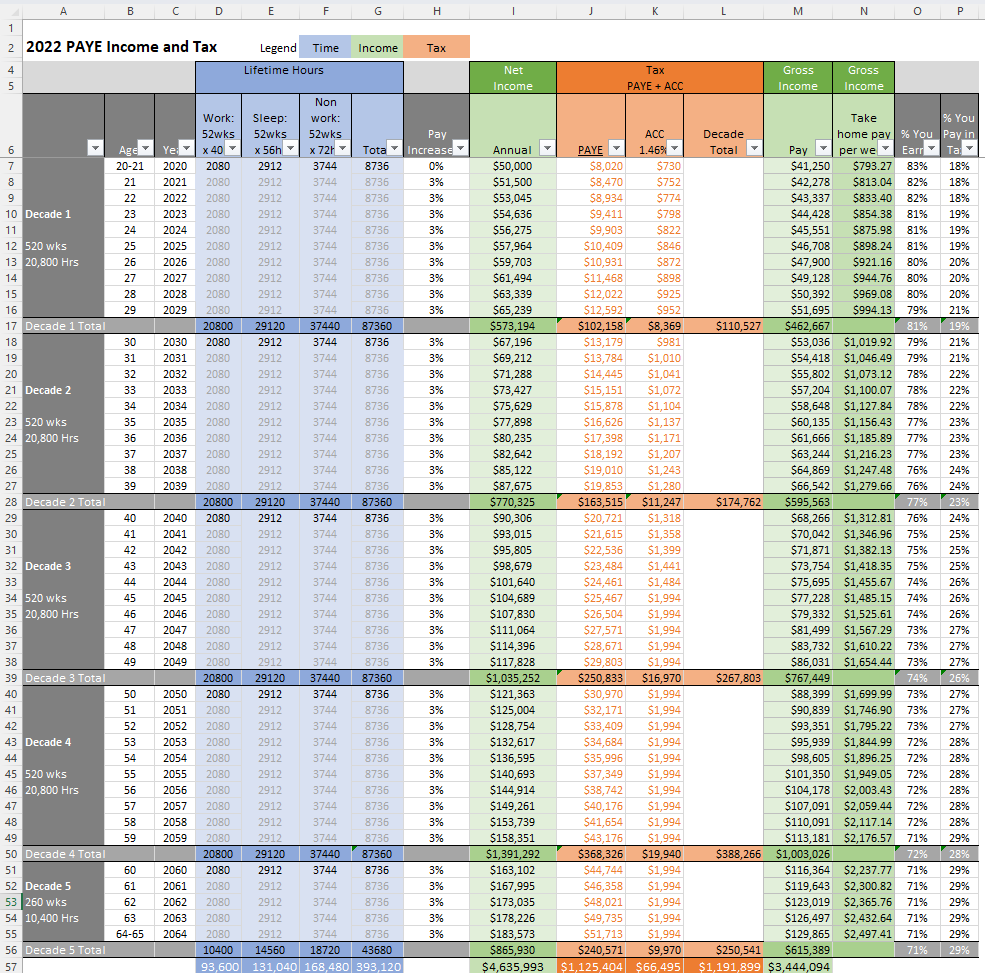
Behold…by unleashing the awesome power of Excel, I have created a Workbook that shows age/time and money.
- It’s an impossible task to create it for every use case or scenario, so I’ve applied the 20-45-20 maxim and the 45-80-4.5 maxim for simplicity, and also started you on an income of $50,000 with a 3% pay increase each and every year for 45 years (even though you do fa) OECD age of retirement Labour Market Stats
- Tax: Also at no extra charge (and to annoy you), I have included your PAYE tax liability. Note that I have not shown the additional GST of 15% which is applied to nearly everything you buy, because in Decades 1 or 2, you might spend everything you earn week to week but in Decades 3, 4, and 5 you might not.
- Again you should be able to pinch-zoom in on the image (unless you are using your nana’s phone).
- I have included a link to the Excel workbook – which has separate tabs for each screenshot – so you can do your own modeling and debunking here
Optimised Life
- Through all the noise, fear, and uncertainty of contemporary life, I think it’s possible to live in a financially optimised way that enables you to create a balance between work/non-work. If you think about all the sh!t you buy and map that against your 45 years of work, you might think twice next time your on Aliexpress (see also Shityabi curve)
- Of course, it is difficult to reduce your tax liability because we don’t choose how much we pay, but you can trade potential income for time, especially with changes to the Modern Workplace in the last 3 years (out of scope for this doc).
- Only a dumbwhuc would pretend to know how your life cycle will unfold – you need to discover your own life patterns and algorithms and make those decisions for yourself.
TAX
TAX = PAYE (~25%), + GST (15%), + ACC (1.46%)
- It seems a strange ‘group think / echo chamber’ phenomenon that citizens don’t consider their personal tax liability and how it impacts their lives. We are programmed to dutifully pay tax without asking how it is used or wasted by the government (I used to think they wasted 40% of tax money but now think it’s more like 80%). Of course, you might argue that’s a good thing especially if you are a public servant. Or because the less we know the better lol.
- We vilify high-income earners for not paying their fair share of tax, but only a whucwit would pay as much tax as they can, or think the Government can spend their money better than they can lol. A wise person would pay as little as is legally possible.
- Whoever is in the so-called 3% of high-income earners does not usually stay there for long, and they usually don’t arrive there until at least Decade 3 or 4.
Unspoken Truth about Work
- If you CHOOSE not to develop a skill you can monetize, then it is LIKELY you will remain around the minimum wage for many decades, and get stuck on earning just the 4.5 milly.
- In your first decade of work, you will live on noodles and live on your pay week to week, it’s not until your 3rd decade of work that you will have accumulated money, assets, and security (Noodles to Oodles).
Critique of this post
- Only assumes a modest income for an unskilled worker as opposed to a highly skilled worker that will earn much more. Note: the skilled worker may also have earnings that start later e.g. 27yo and also have a massive debt to begin their career because of study costs
- Only assumes work start age of 20 and end age of 65
- It does not show any breakdown of earnings in different use case scenarios e.g. business, contractors, absences from workplace, etc.
- Only shows 3% pay rises year on year
Other
- Inflation and CPI are also not referenced in this post although, at the time of writing, it is >7%
- There are heaps of calculators out there for different countries so you can confirm my tax calculations, this is my current fav: MoneyHub NZ
- You might double your income by getting married
- You might half your income by getting married
Additional Reading
This document forms part of a 3 blog series:
- Part 1: Your work lifetime hours and income deconstructed (THIS DOC)
- Part 2: Cross the F45 Line (INCOMPLETE)
- Part 3: Money and Time Hacks (INCOMPLETE)